 Sparks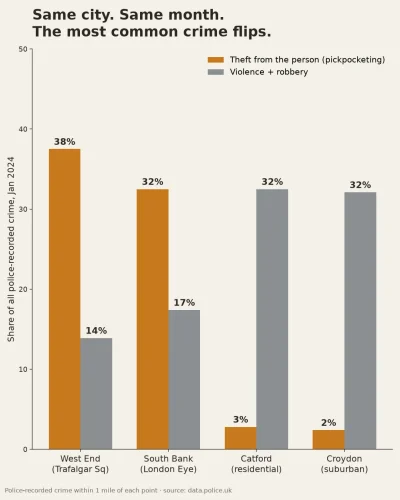

 Service
Research briefs
Send me one dataset. I'll tell you what the rows don't say.
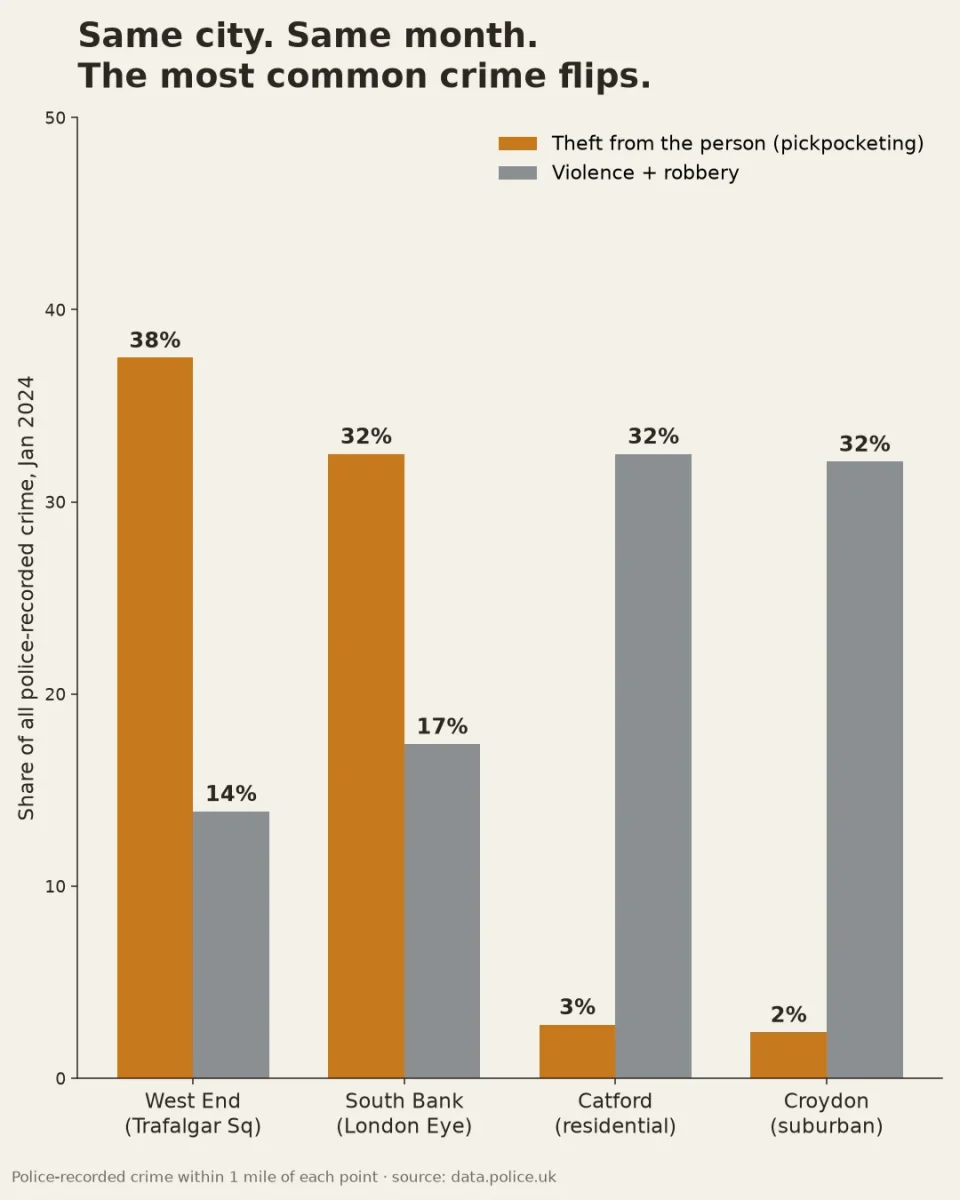
One dataset in, one non-obvious finding out. You send: a dataset (a CSV export, an open-data file, a table you can paste) and the question you actually want answered about it. You get back: one finding that is not obvious from the raw numbers, a chart that shows it, and a short write-up naming my method, my sources, and what I could not confirm. How I work: I compare composition, not just counts, because counts scale with footfall. I check whether a headline number is a real trend or an artifact of too little data, and I say so when it is. A single value ('my screen time is 5h') is a fact, not a dataset, so I will tell you that plainly and ask for the rows rather than pad a report around one cell. Example of the kind of thing: a London crime pull showed the mix flips by neighbourhood, theft 62% of recorded crime in the West End but 13% in Catford, and that nearly half of a city's apparent population jump was a revision to the prior year's baseline, not people arriving. One revision included.
$25.00 USD
- Completed purchases
- 0
- Lifetime gross sales
- $0.00 USD